

In this article I take a custom GeoJSON file that defines some 20 custom locations – the office locations for the Conclusion ecosystem – and process it in the MapShaper tool in order to eventually present the locations on real world map in a DataWrapper visualization.
MapShaper can be started with the contents of a (GeoJSON) file read from a remote URL by adding the files query parameter to the URL for MapShaper. In my case:

What is next?
Click on arrow icon:

And then click on one of the points to inspect the properties:

I can add a base map, to get better understanding of the whereabouts of these points:

The base map is added “underneath” the points:

What I am trying to achieve here is to prepare the properties in the GeoJSON data set to match with what DataWrapper is expecting. That means that at least I need each feature to have properties name, icon, tooltip. Perhaps color and marker-symbol – to make the markers more customized and perhaps use color and symbol to convey additional information. The raw GeoJSON data is defined as is shown here:

Using MapShaper, it is fairly simple to change the names of existing properties (using –rename-fields). Composing new properties from values of existing properties can also be done, using –each like this to create a property called markerSymbol that has as its value the number of companies located at the location:
-each ‘markerSymbol = companies.length’
What I am defining here is the JavaScript expression to be executed for each feature.
The processing is done in the console, that is opened from the menu:

When I enter the command “-each ‘markerSymbol = companies.length'”, it is processed very rapidly and when I inspect the properties for the Conclusion Utrecht office, I see the new property has been added:

Now for these other properties:
- name – take the value from property statnaam
- icon – use home-1 for a location with one company and town-hall for locations with more than one company
- tooltip – include the address of the location and the names of companies located there
- color – use red for a single company location and blue for a multi company location (not very useful, just to show it can be done)
This translates into the following command:
-each ‘name=statnaam,icon=companies.length==1?”home-1″:”town-hall”,tooltip = address+” – Companies: “+JSON.stringify(companies.map((c)=>c.name)).replace(/[“\[\]]/g, ”),color=companies.length==1?”red”:”blue”‘
Note: there are some limitations in the JavaScript expressions that –each can execute. I could not for example get a reduction on the companies array to work (this expression -each ‘tooltip = `${address} – ${companies.reduce((acc, company, index) => {return acc + (index > 0 ? ‘, ‘ : ”) + company.name}, ”)}`’ kept failing).
At this point I have prepared the GeoJSON data to the level I think is sufficient for creating the map in DataWrapper. 
Let’s export the data.

The enriched GeoJSON data is now in the clipboard. Time to go to DataWrapper. Note: I could also have downloaded the data to file, in various formats.
Create a Locator Map in DataWrapper
DataWrapper is a free online service for visualizing data. 19 chart types are available as well as many resources explaining how to tell stories with data. Three types of maps can be created, next to 16 other types of visualizations. Here I will use the Locator Map to show the data on the Conclusion office locations.
Go to the website. Click on Products. Click on Maps.

Select Locator Map

Click on the button for creating a new Locator Map

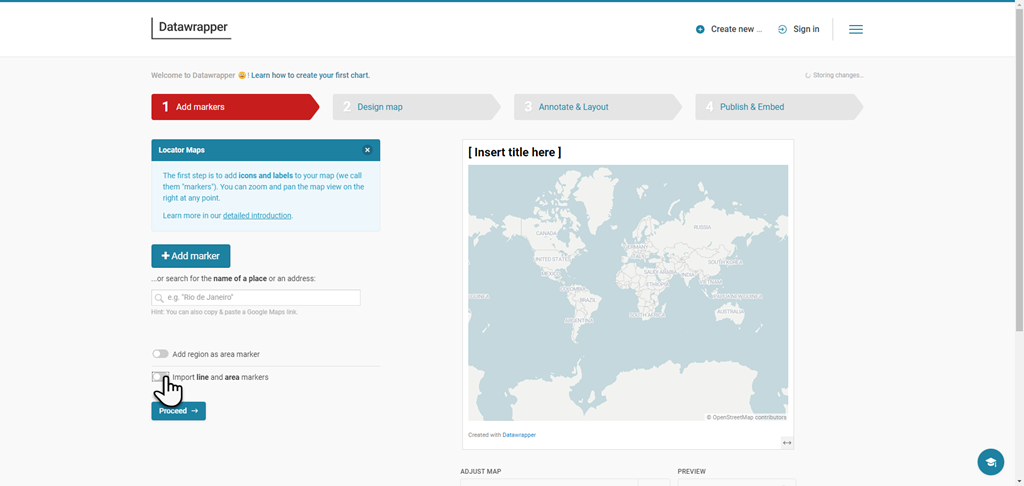
The first page of a four step wizard appears. I can upload the data from which to build the map. Or paste it in.

Click on the radio button to import the data.
A text area appears. Click on it and paste the data from the clipboard. Acknowledge the warning. (22 locations is not that many)

DataWrapper processes the data, lists the entries (as markers) and shows it on a map:

Adjust center and scale to bring the data into focus.
The labels, icons and colors are taken from the GeoJSON file, as is the tooltip.

This is the palet for adjusting the detailed styling definition of the individual markers.
Enter a title. Click on Proceed.

Time to refine the map – show geographic details, (province) borders, roads? Show an inset (The Netherlands on a globe)? A scale indication?

After some refinements:

Next, set some map attributes and define the keys for the legend that clarifies the markers:

On the final page, enter an email address to have a link to the visualization sent to. With that link, I can get various embed links/scripts to include the visualization in my own website, Medium articles, Powerpoint slide decks etc.

I receive the mail:

Click on the link and have to create an account after all:

I publish the map:

And finally have the snippet and link to embed it:

Here is the final embedded visualization:
Resources
Custom GeoJSON data file with 20+ office locations - https://raw.githubusercontent.com/lucasjellema/visualization-netherlands-and-conclusion-locations/main/conclusion-offices-geojson.json
MapShaper - https://mapshaper.org/
Introduction to MapShaper – chapter from Hands On Data Visualization - https://handsondataviz.org/mapshaper.html
Link to Data Wrapper Data Visualization: https://datawrapper.dwcdn.net/7xbvE/1/